

Safety reporting software that answers the question.
Construction safety reporting software that turns live field records into board-ready answers.
Bring the weekly spreadsheet, owner report, or broker packet you build by hand. SALUS replaces the hunt behind it: forms, QR scans, inspections, training, incidents, and corrective actions flow into one Looker reporting layer, with Rosie on top to answer questions and open the source record behind every number.
Rosie has been very beneficial within our organization, especially due to the size of our company and the amount of data that is accumulating within SALUS… we can utilize Rosie AI to expedite the information we need to ensure compliance across our organization.
The report starts before anyone opens a spreadsheet.
Crews do the work. The report builds itself.
A weekly report is only as good as the records behind it. SALUS captures those records while the job happens: a QR scan, a form, an inspection, a training completion, an incident, a corrective action. No second reporting step. No Friday reconstruction. Adoption becomes data quality because the report is built from the work itself.
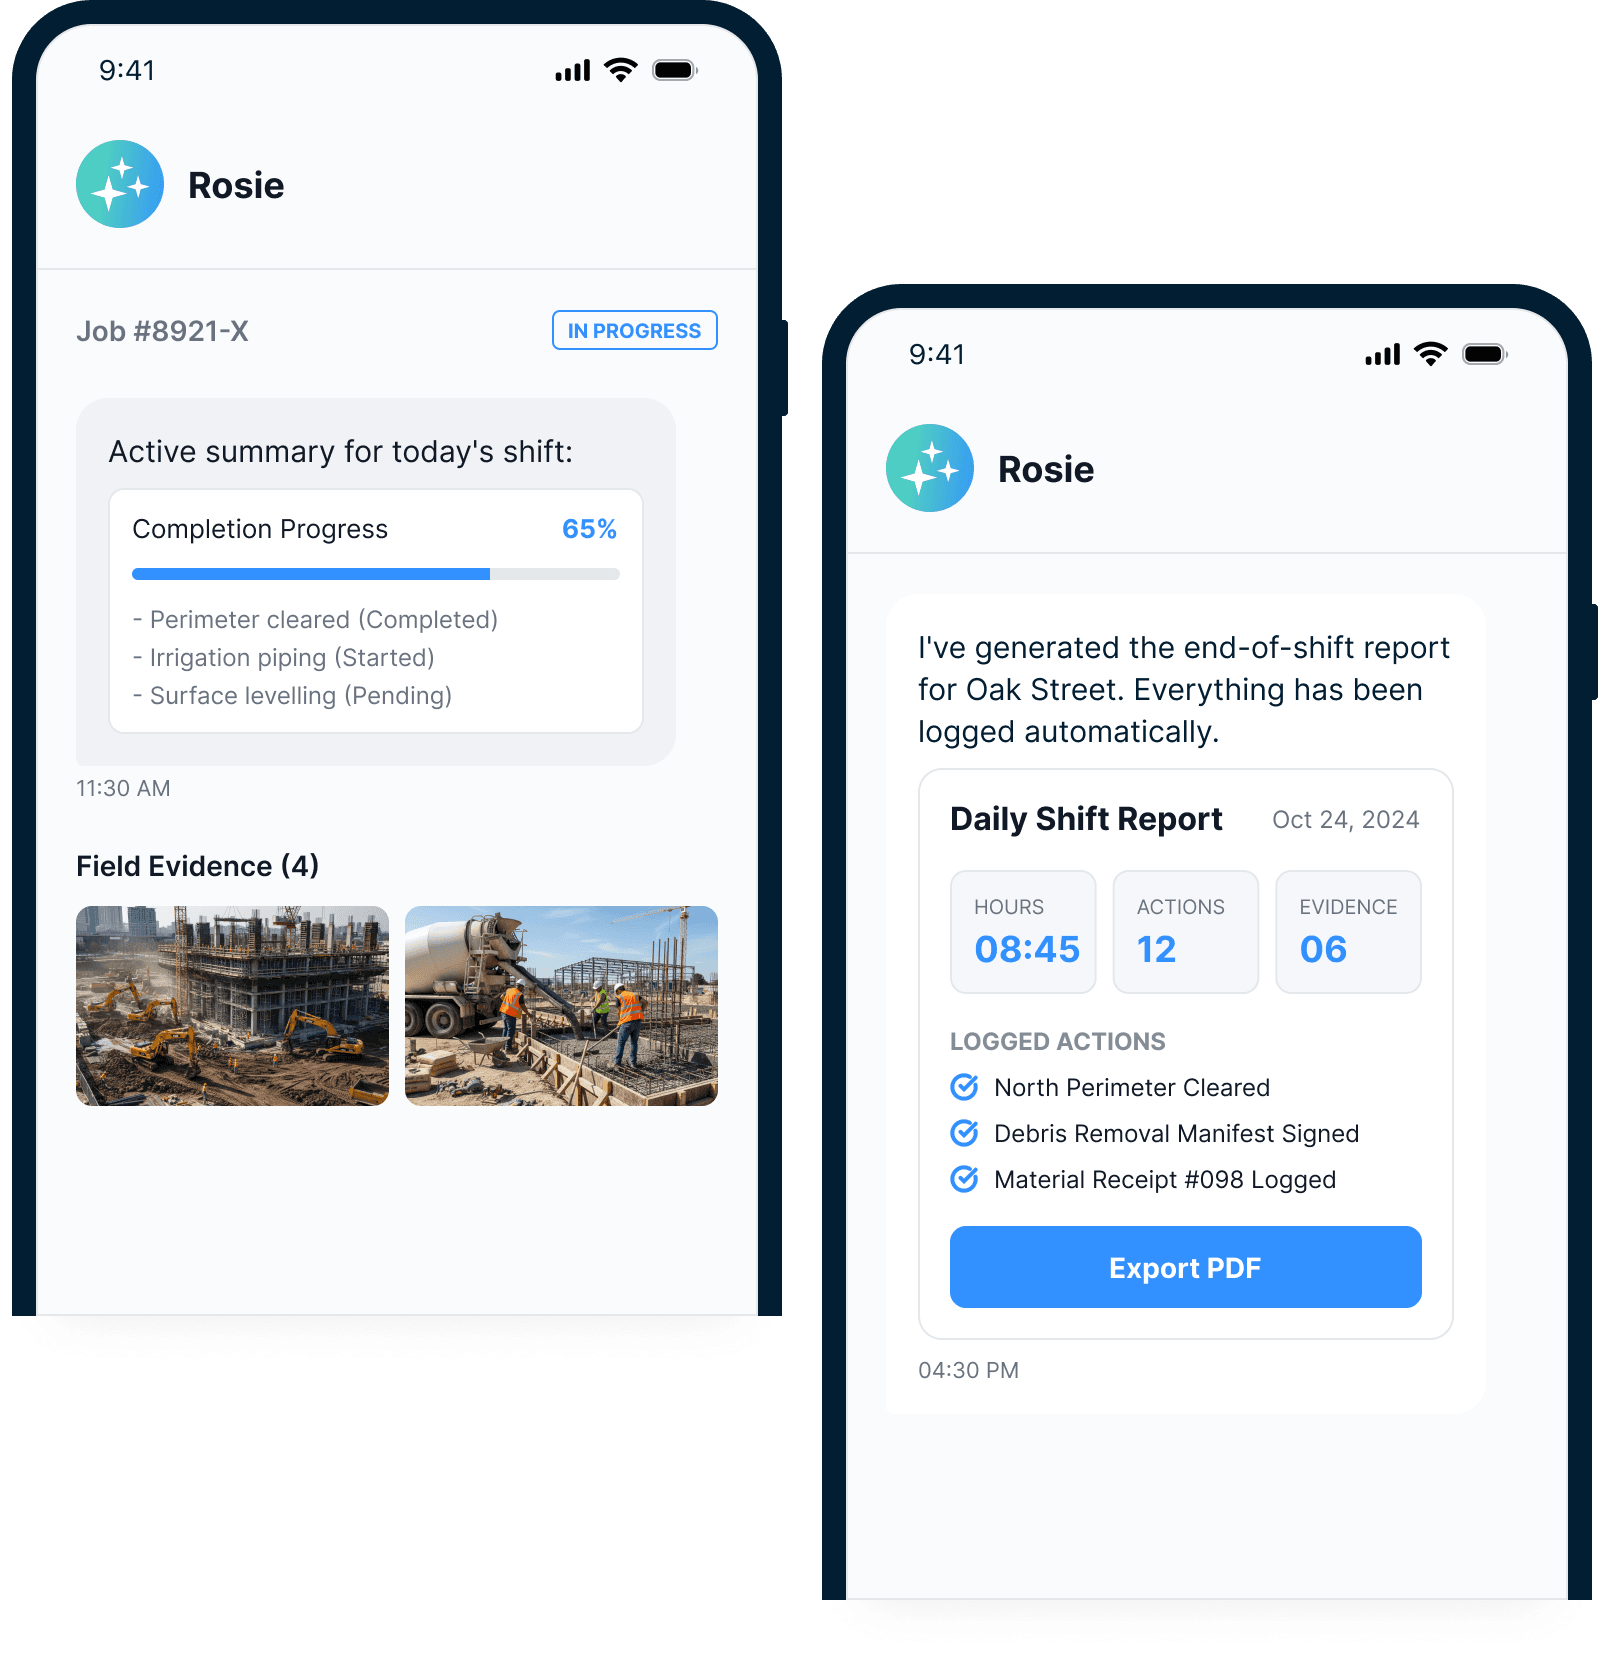
No chasing. No reconstruction.
One construction safety reporting layer.
Embedded Looker analytics, every signal connected.
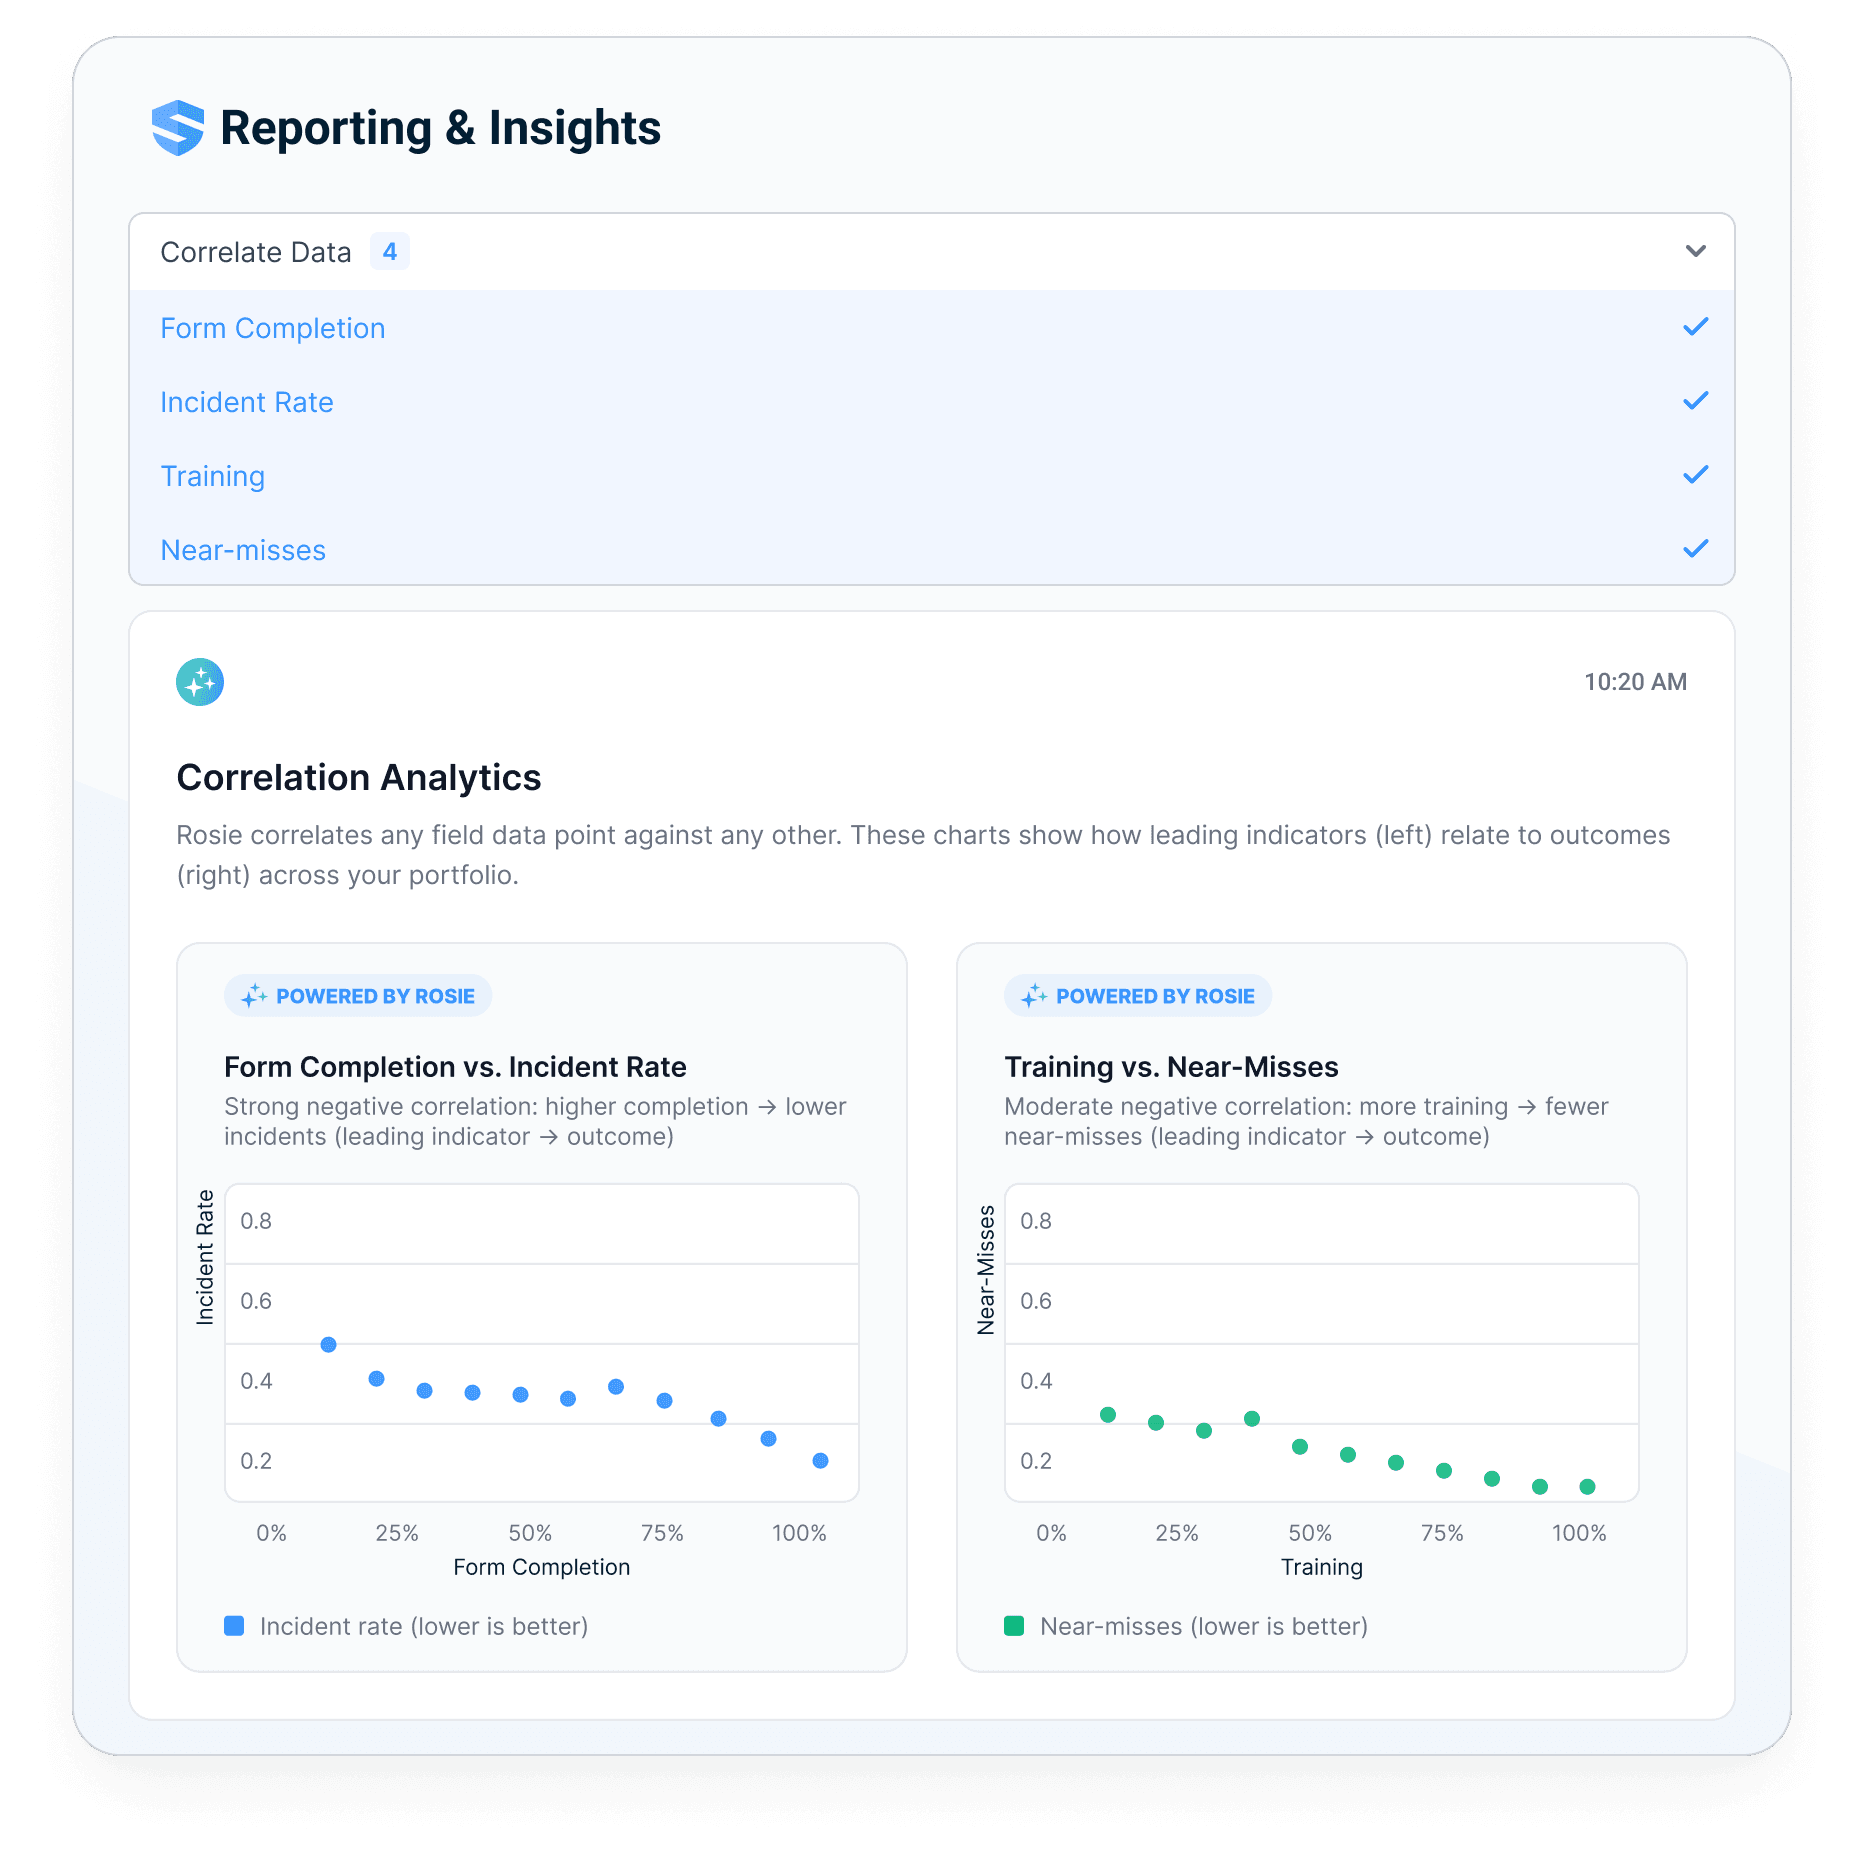
SALUS embeds Looker directly in the platform. Orientations, forms, training, equipment, incidents, corrective actions, QR scans, and worker profiles all feed one reporting layer, so the question can cross modules: form completion against incident rate, training against near-misses, sub performance against project risk.
One of the biggest benefits is the ability to quickly compile reports and monitor leading indicators, making it much easier to identify trends and improve our safety performance. The reporting features save a significant amount of time each month, and having everything in one place has improved our overall efficiency.
 Verified construction reviewer
Dashboards show what happened. Correlations explain why.
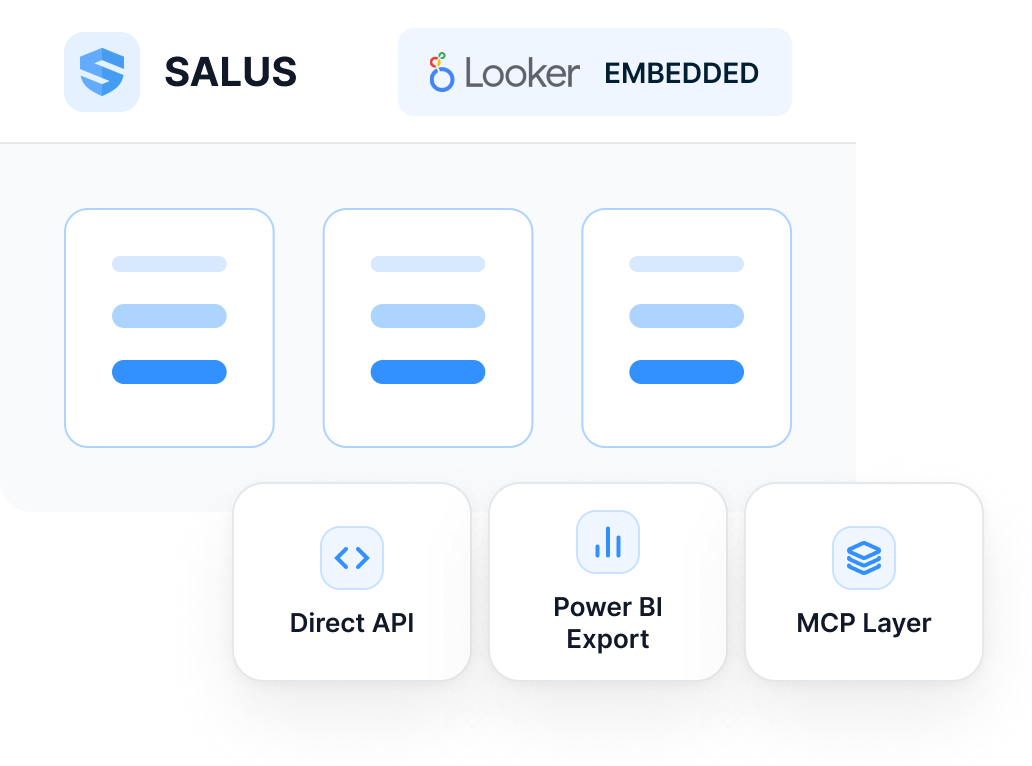
Power BI, API, and MCP — your data goes where decisions happen.
Safety teams work inside SALUS. Analysts can pull native Power BI exports. Developers get a direct API. AI tools can query the safety record through the MCP layer, so the CFO dashboard, broker renewal, Procore workflow, and executive packet can all point at the same live record.
No export ritual. No data hostage.
Live construction safety dashboards — answers before the meeting.
Ask Rosie. Get the report and the next move.

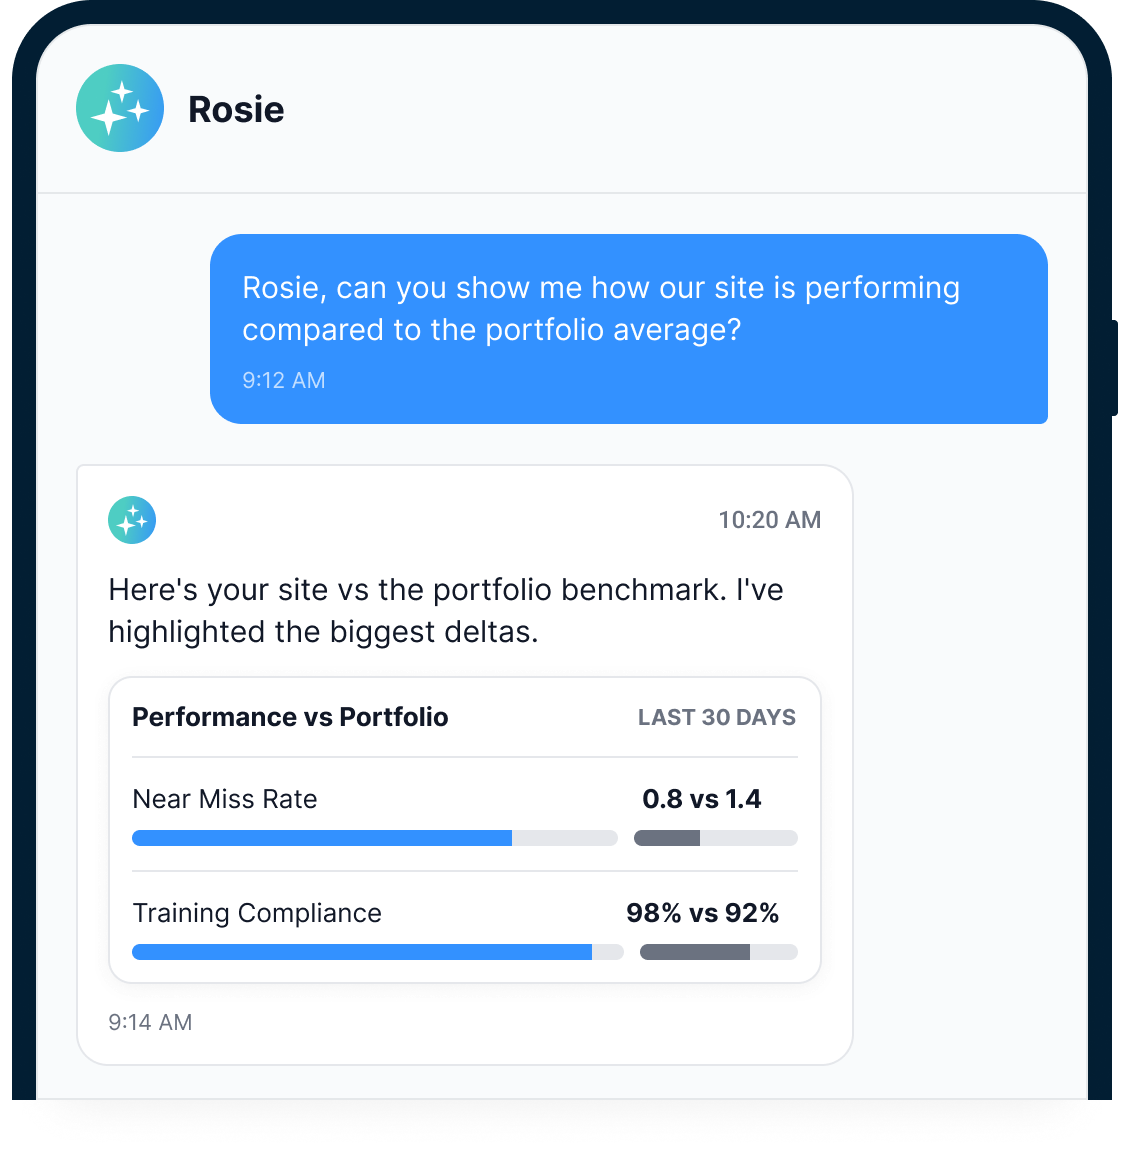
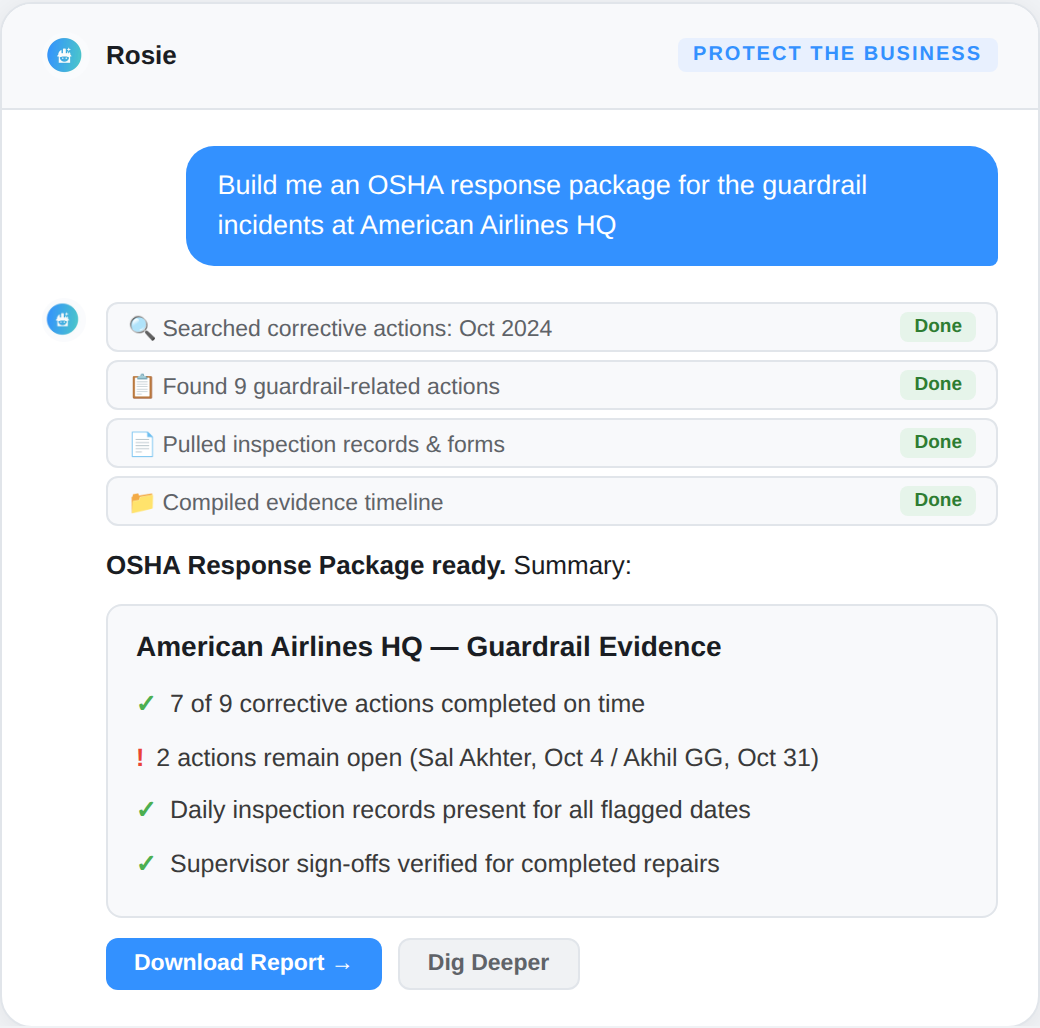
Ask in plain English: how this site compares to the portfolio, which subs are slipping, where form completion dropped, or what trend needs attention before Monday. Rosie returns the answer from live data, then points to the records behind it.
With AI/Rosie, you can ask it to run all types of reports … for an audit or a quarterly review … and have Rosie break it right down to site-specific and overall performance of the company.
Jeff K.The answer arrives with the next action.
- "Which sites missed required inspections this week?"
- "Which subs have aging corrective actions?"
- "Where did form completion drop after a crew change?"
- "What should I watch before the owner meeting?"
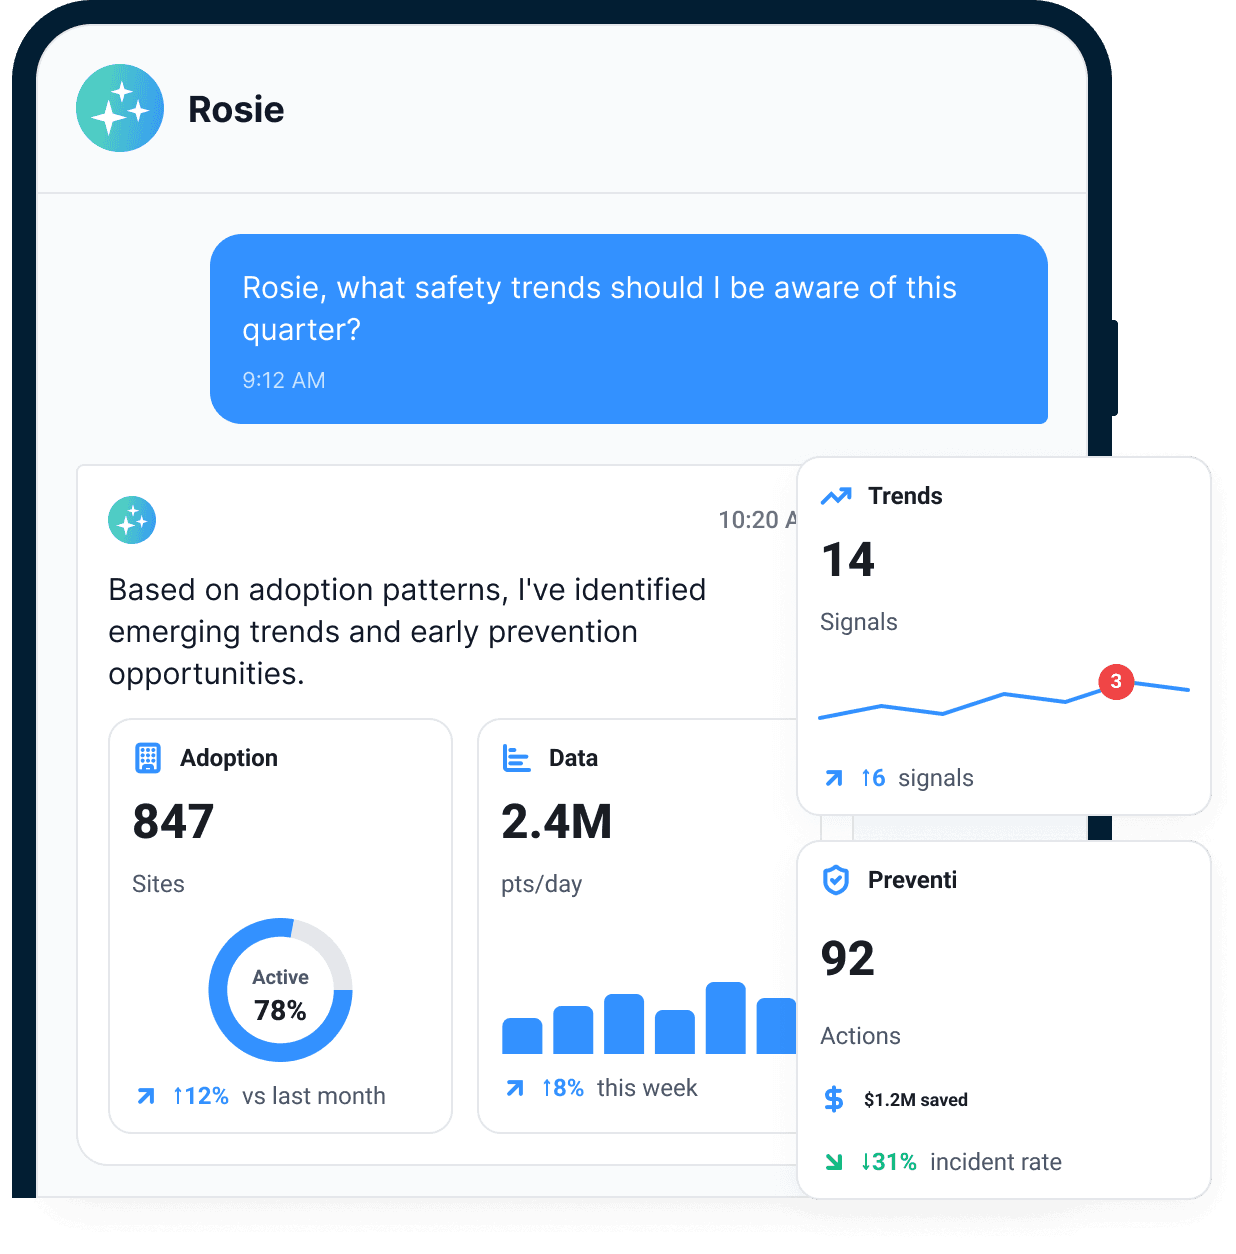
From Safety KPIs to the source record in one click.
Start with the portfolio view. Filter by project, sub, trade, date range, or risk signal. When a number looks wrong, open the exact source record: who submitted it, when, where, what evidence was attached, and who owns the follow-up.
A number is useful only when it opens to proof.
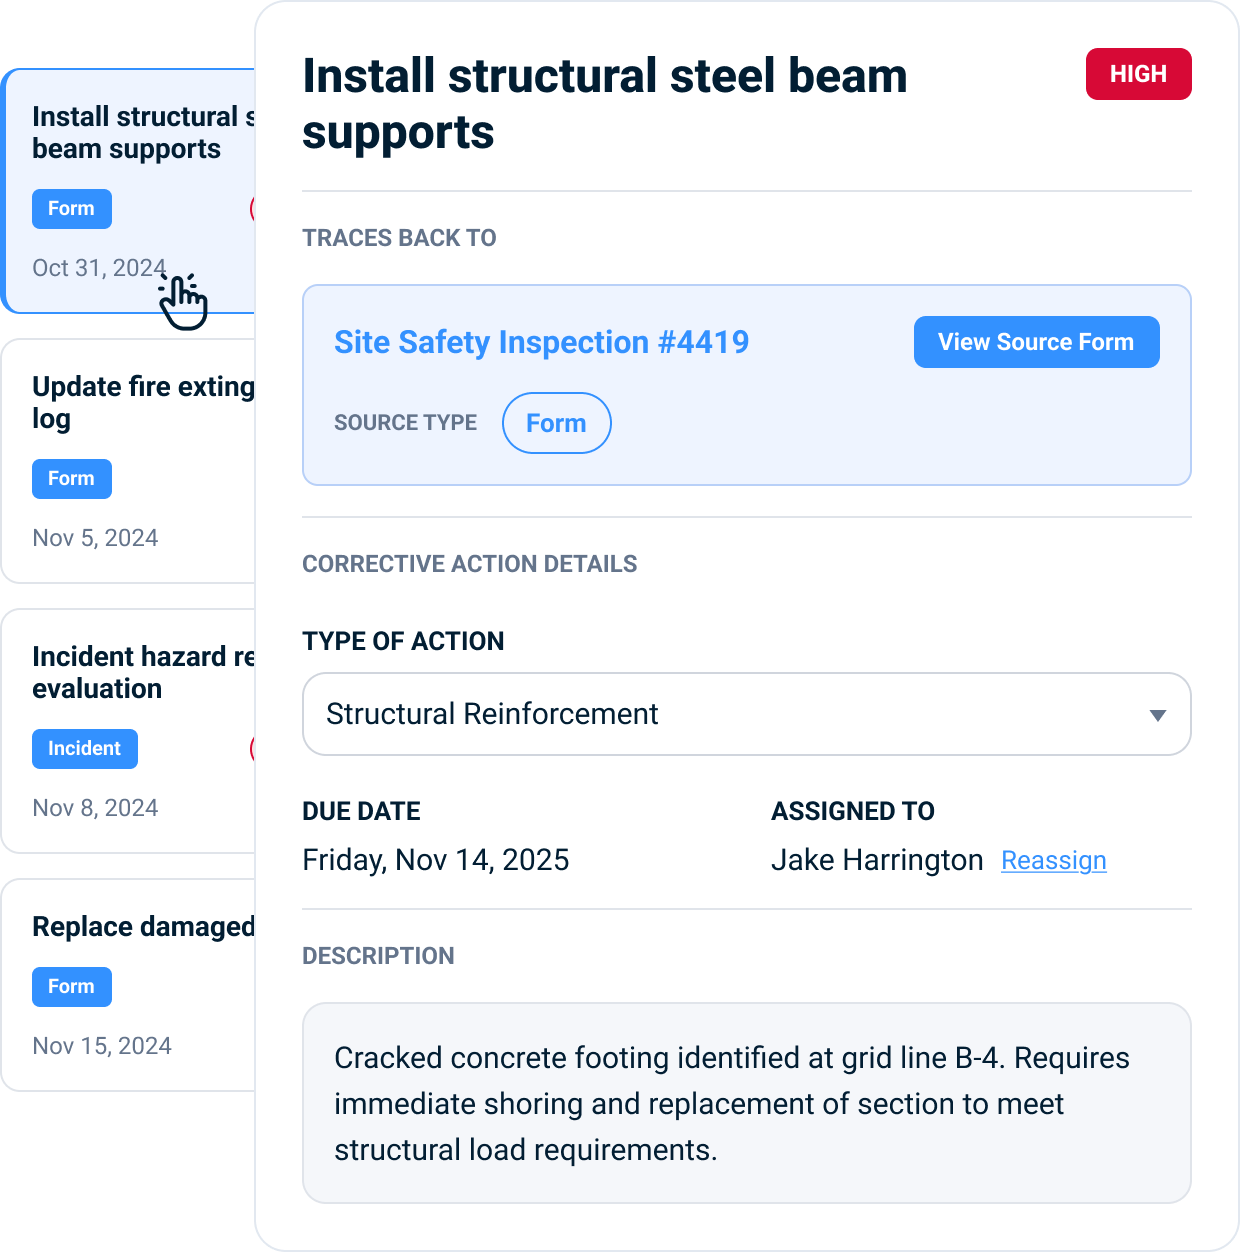
OSHA-ready safety records without spreadsheet archaeology.
OSHA recordkeeping stays tied to the live source record. Incidents, inspections, corrective actions, photos, sign-offs, and dates stay organized for your OSHA 300 log, 300A summary, and Form 301 details. TRIR and DART conversations still need hours worked, but the incident side is current and traceable.
OSHA 300 log
Incident records organized from the connected safety record.
300A summary
Summary-ready data without rebuilding the year by hand.
Form 301 detail
The incident evidence behind each recordable case stays attached.
Recordkeeping stays connected. The source is still one click away.
Bring your current weekly report.
Safety KPIs and leading indicators, built from live work.
The point is not another chart. It is a cleaner answer for every person who asks: operations, executives, owners, brokers, and regulators. The same live record supports leading indicators you act on and lagging indicators you report.
Leading indicators
Inspection completion, training currency, near-miss reporting, and corrective-action closure time.
Lagging indicators
Incident and near-miss trends by project, sub, trade, and time period.
Stakeholder proof
A cleaner story for owners, GCs, brokers, executives, and safety committees.
The reporting layer behind the weekly report.
Rosie answers
Plain-language reporting from live portfolio data.
Looker analytics
Google's enterprise analytics engine embedded inside SALUS.
Source drill-down
Every number opens to the field record behind it.
OSHA-ready records
300, 300A, and Form 301 support stay tied to incident evidence.
Open data access
Power BI, API, MCP, and Procore context from the same live record.
One answer layer for the people waiting on the report.
Safety directors
See which sites, subs, and actions need attention before the weekly meeting.
Executives and boards
Turn the CEO's question into a current answer with source proof behind it.
Brokers and renewals
Walk through leading indicators and live proof instead of a static packet.
OSHA recordkeeping
Keep recordable incident details and supporting evidence organized from the start.
Pick the pressure behind the report.
If the report exposes risk, go to Risk Control. If the report needs to satisfy an outside audience, go to Proof on Demand.
The question starts here.
The fix lives there.
Keep the OSHA recordkeeping rules beside the workflow.
Use the current OSHA 300 Log guide and free workbook to connect field records to the reporting obligation.
Construction safety reporting FAQ.
What is construction safety reporting software?
How is SALUS different from a dashboard-only reporting tool?
Can SALUS replace our weekly safety report?
Does SALUS support OSHA reporting?
Can our data team use the raw data?
What if crews don't use the app consistently?
Can owners, GCs, brokers, or executives see the proof?
Bring the report you build by hand.
We'll map the live version.
Request a demo with your current weekly report, owner update, or broker packet. We'll trace each metric back to the field records that would feed it and show the questions the current report cannot answer.
Stop spending weeks learning what your program already knows.