

Crew data: the missing layer between Procore and the crew.
Project systems know the job. Daily reports summarize the day. Crew-level data explains what actually happened.
Email me the data map
We’ll email you the printable version and give you immediate access here.
It’s on its way—check your inbox.
Download now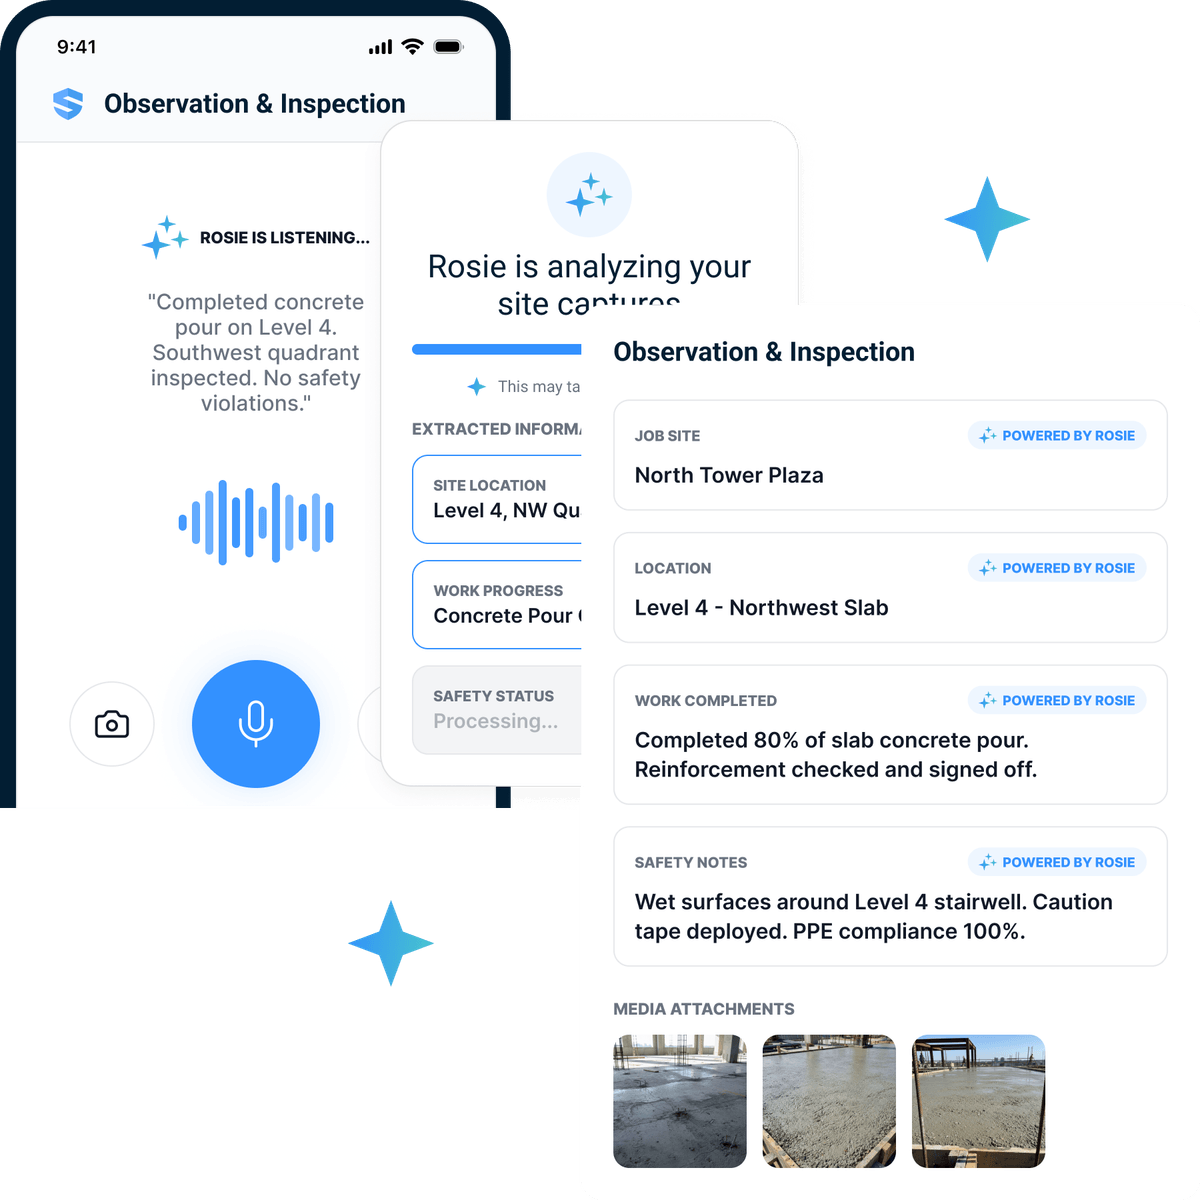
Contractors already have Procore, daily report tools, photo apps, spreadsheets, text threads, and safety systems. And yet — even with all of it — simple field questions still don't have clean answers:
That gap exists because most construction systems are built around the project record, not the crew moment. That gap is crew-level data — the operational facts captured from the people closest to the work, while the work is happening.
What is crew-level data?
Crew-level data is the information captured from the jobsite while work is happening — tied to a worker, crew, task, location, and time. It includes who was there, what work was underway, what risks or changes appeared, what forms or permits applied, what photos or notes were captured, what questions were asked, and what actions followed.
It's the part of the field record closest to the work — the operational truth a project system never sees.
- ?What was the crew doing when the issue came up?
- ?What risk was identified before the task started?
- ?What changed in the field — and who saw it?
- ?What proof was captured, and what action followed?
- ?Did it affect safety, production, quality, or claims?
Why project systems miss the crew moment.
Procore and the rest aren't weak — they're incomplete for this specific layer. The official project record is not the same thing as the crew moment, where work actually starts, changes, stops, gets questioned, gets corrected, or gets proven.
The Field Intelligence Layer.
The connected record of crew-level facts captured while work happens — and made usable across safety, production, reporting, claims, and AI.
Why operational safety creates the best crew-level data.
Operational safety is already attached to the real moments of work. Tap each safety task to see the crew-level facts it captures in the moment — and how those same facts feed the daily report, dispute resolution, and risk intelligence.
 Crew-level data
Pre-task plan (JHA / FLRA)
One pre-task plan captures crew, task, and risk — and feeds the daily log, readiness proof, and the claims record.
- Crew, task, location, and the hazards identified
- Controls discussed and who signed off
- Timestamped before work starts → feeds the daily log & claims

The site is ready to mobilize Monday with the plan, orientation, field forms, and hazard controls prepared for the crew.
- Site controls
- Site-specific plan + deployed hazard controls
- Crew package
- Orientation + required field forms
- Languages
- English + Spanish
The site lead confirms the final scope, crew, and local requirements before mobilization.
Hazard & near-miss capture
A photo and a voice note become a structured hazard — feeding corrective actions, the risk dashboard, and the claims file.
- Photo, condition, location, and time
- Voice note structured by Rosie
- Tied to the task and crew → feeds risk trends & the daily log
Inspection & observation
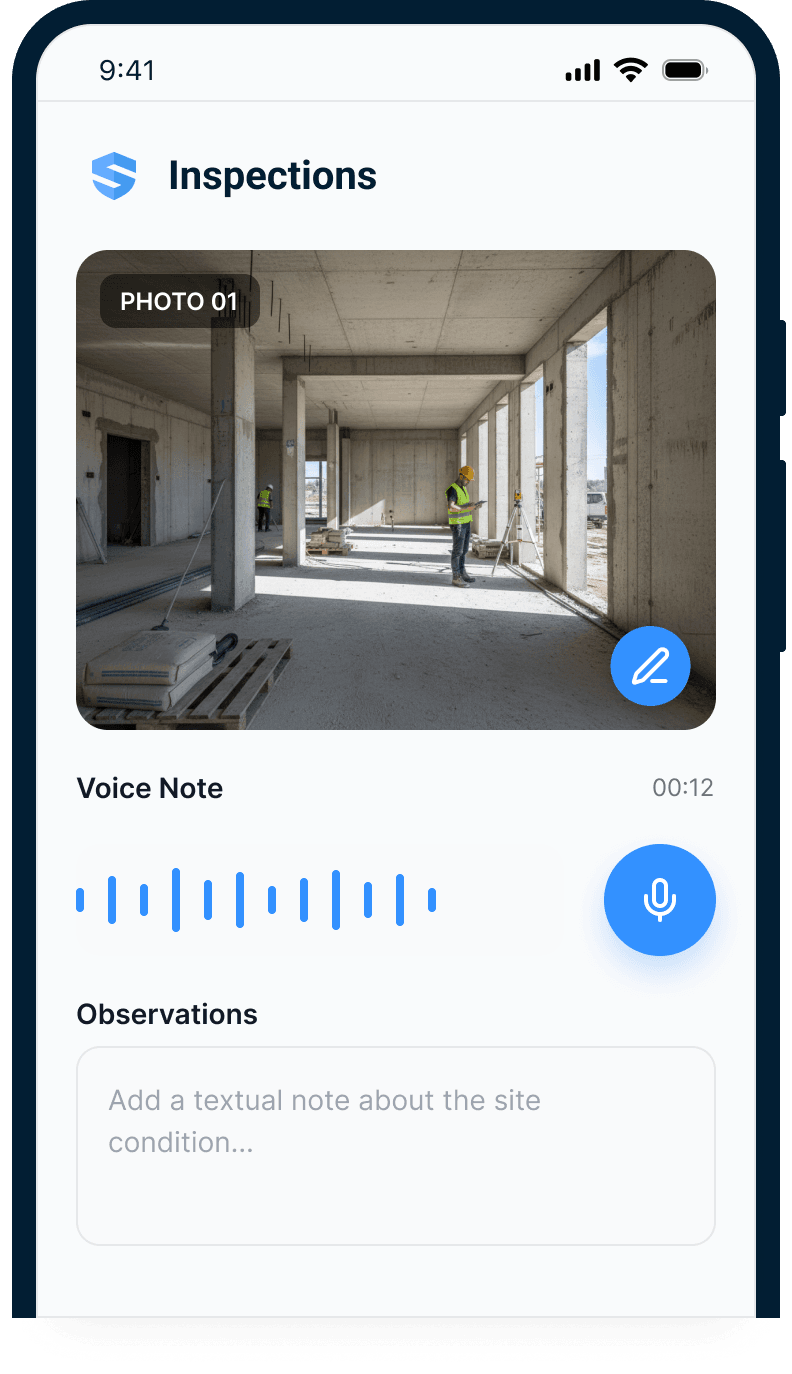
Findings spoken during the walk become tracked deficiencies — feeding corrective actions, quality records, and the daily log.
- Findings and deficiencies with photos
- Pass/fail tied to location and asset
- Corrective actions created in the same flow → feeds quality & claims
Toolbox talk
A toolbox talk captures who attended and what was covered — feeding the training record, the daily log, and audit readiness.
- Topic, date, and attendance
- Sign-offs tied to each worker
- Generated and translated by Rosie → feeds training & the daily log
The toolbox talk is drafted around the event the crew just experienced: treat wet floors as immediate hazards, own housekeeping, and barricade before work resumes.
- Event
- Slip on wet floor · Level 2 · Dec. 29
- Crew controls
- Identify · barricade · clean · verify
- Delivery
- Site-specific talk · ready in 4 minutes
The supervisor reviews the draft and leads the crew discussion before collecting acknowledgement.
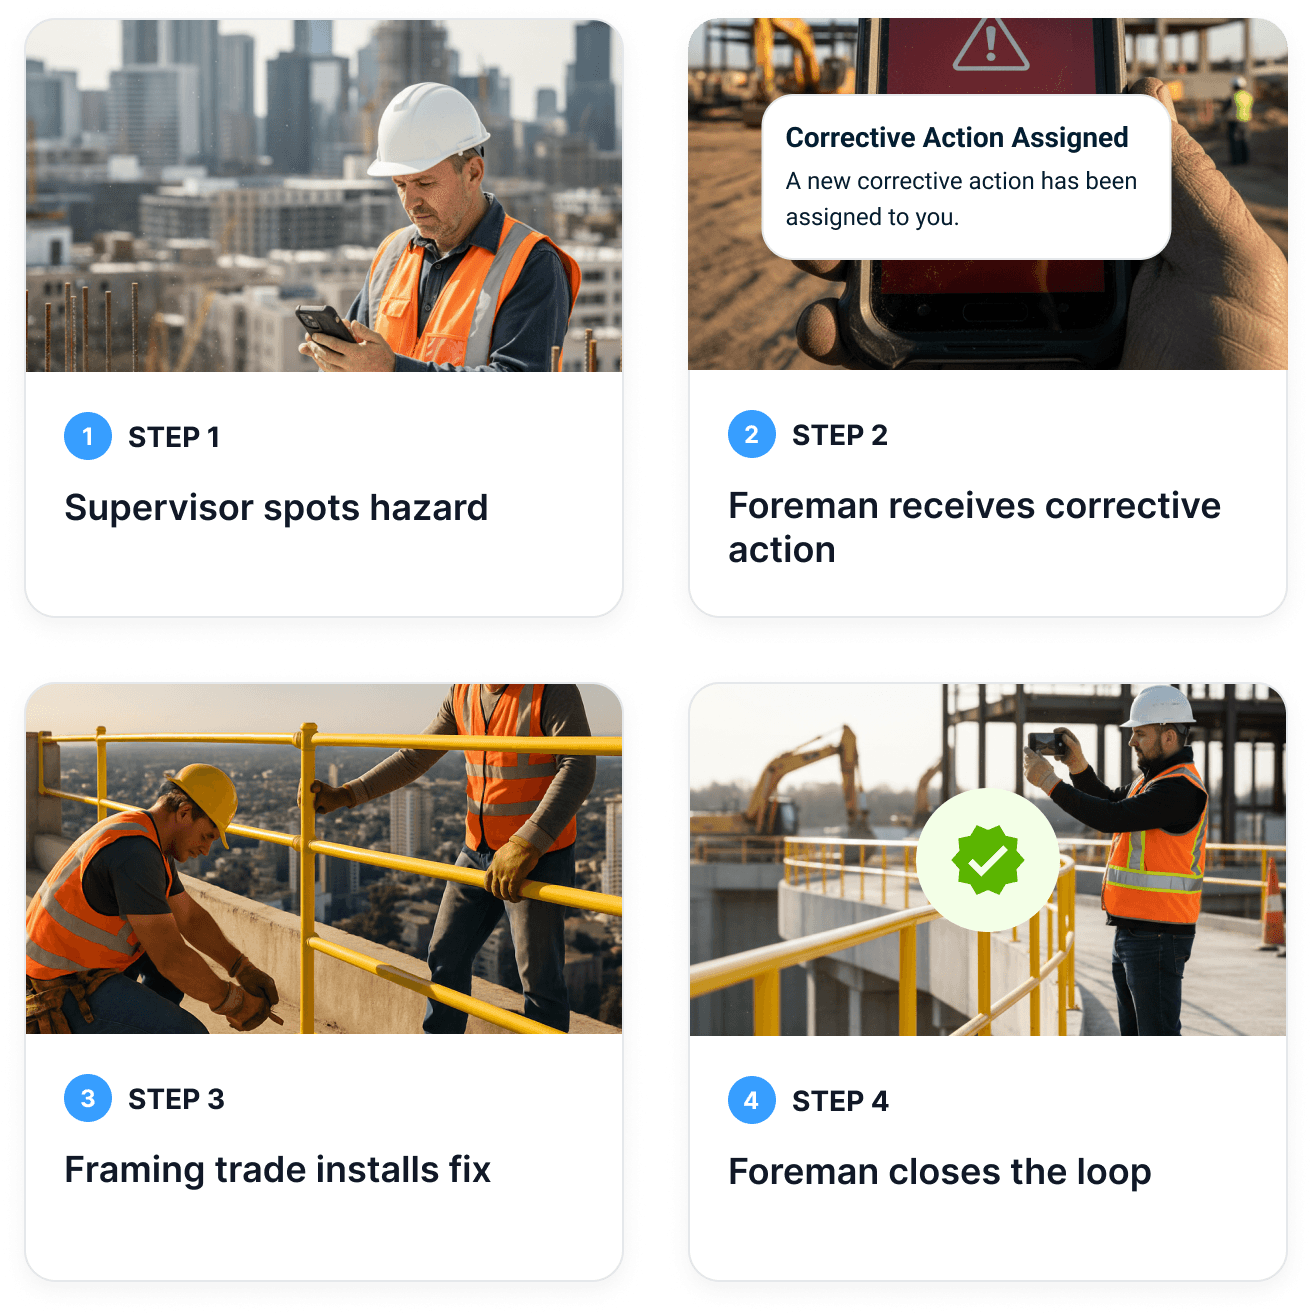
Corrective action
A corrective action carries its owner, due date, and closeout proof — feeding closed-loop follow-through and repeat-risk patterns.
- Owner, due date, and priority
- Closeout confirmed with photo proof
- Repeat patterns surfaced by crew and trade → feeds risk intelligence
Five gaps need attention: ground-level exclusion-zone enforcement, struck-by PPE, an all-clear protocol, a current review date, and pre-task verification.
- Field controls
- Exclusion zone + struck-by PPE
- Communication
- All-clear protocol
- Governance
- Current review + pre-task verification
The safety lead validates every recommended change before the approved procedure is replaced.
The same field facts that help crews work safer today can help protect the business months later.
Crew-level data protects more than safety.
Operational safety is the entry point, but the value reaches schedule, quality, cost, insurance, payment, and claims. The same field event can matter to all of them.
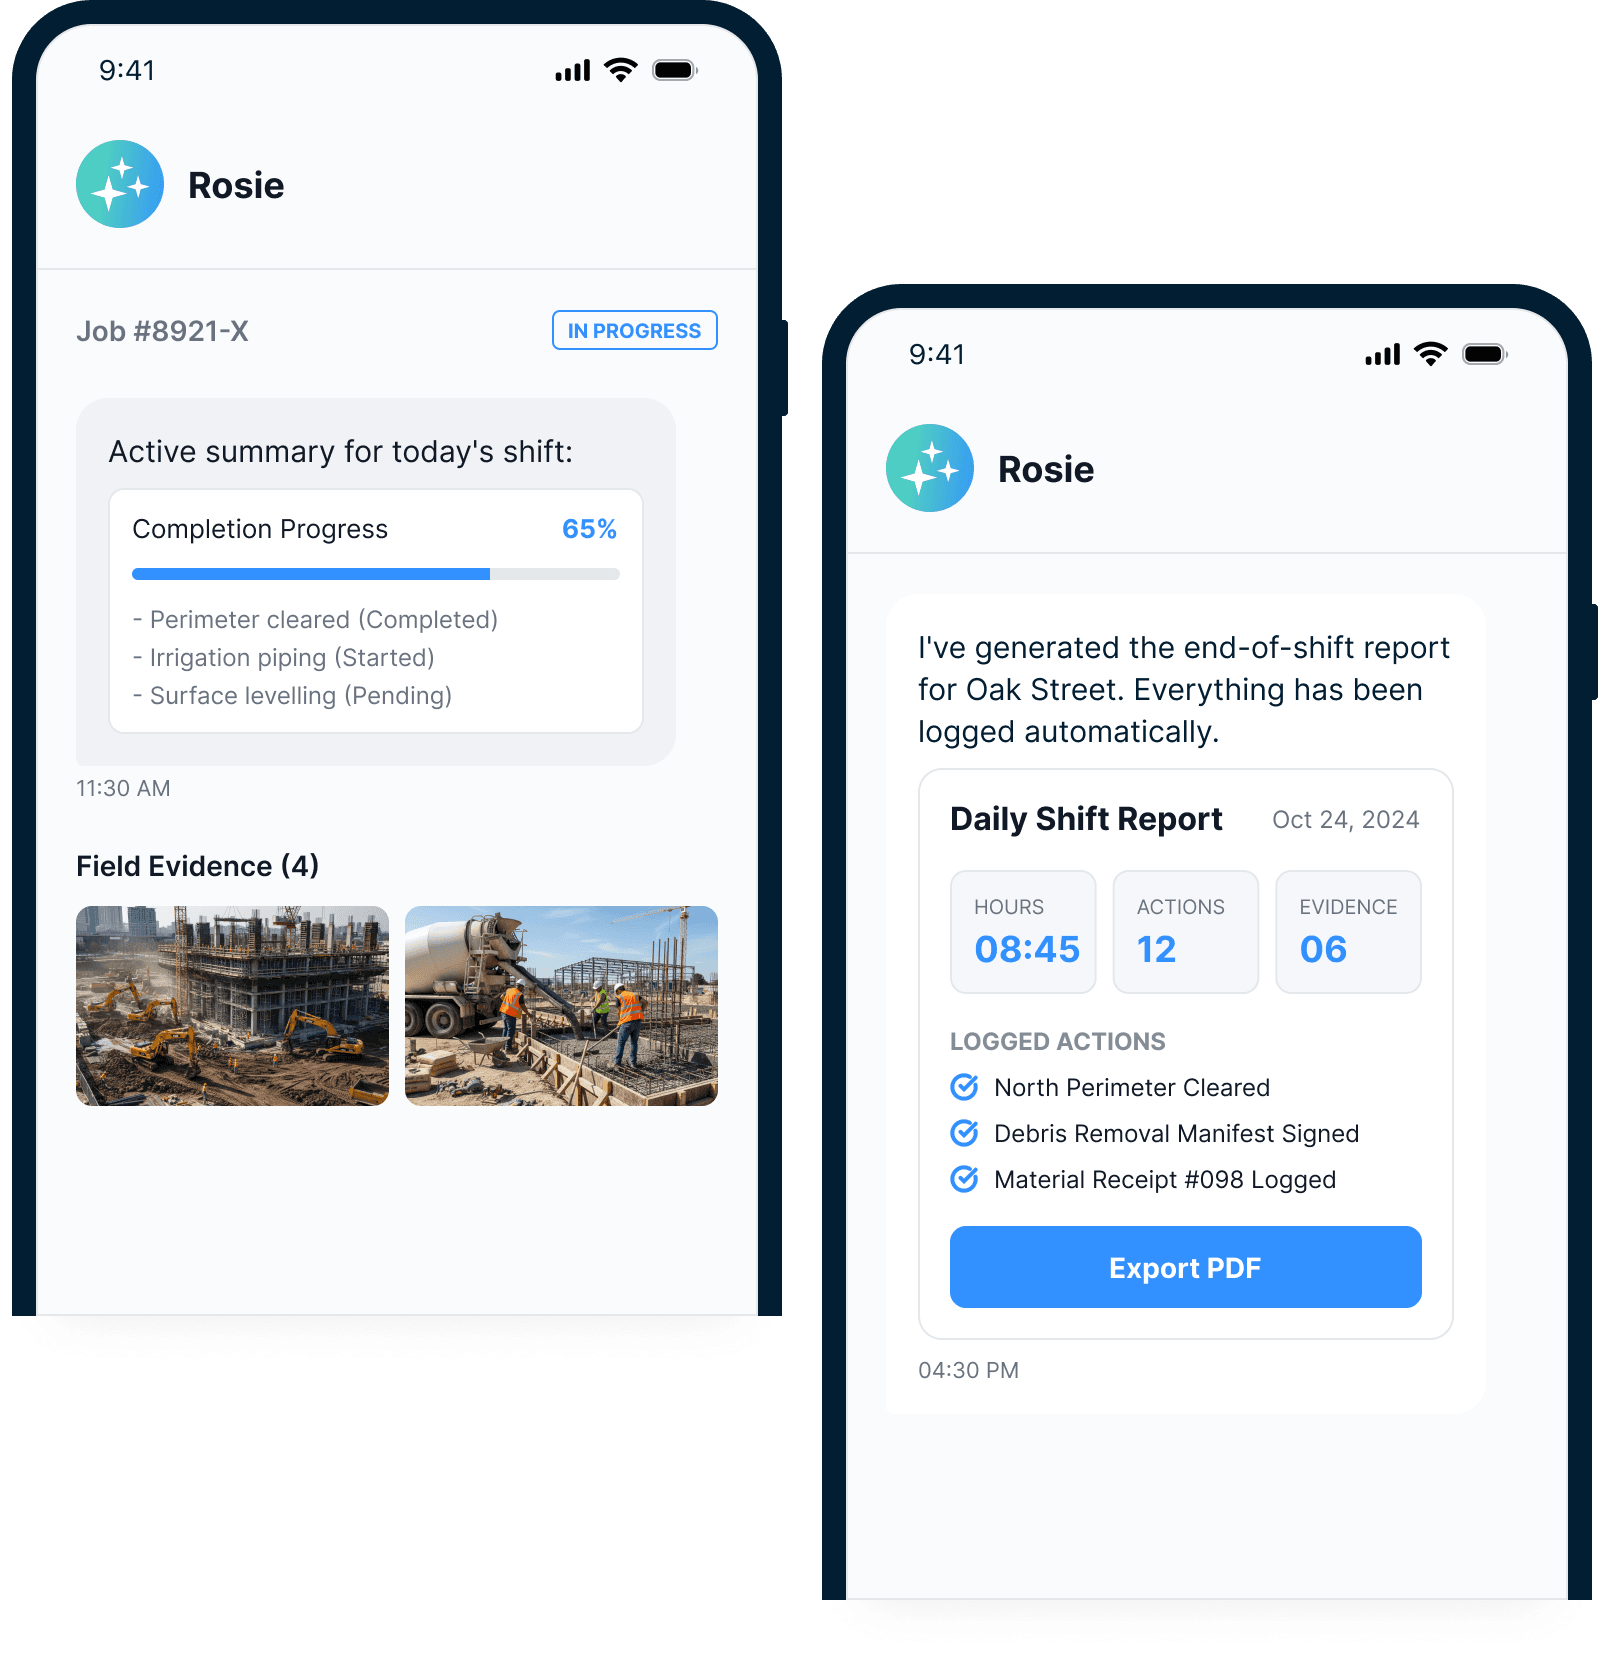
Better daily logs are assembled, not reconstructed.
If the day's operational facts are captured as they happen, the daily report becomes an output of the field record — not a reconstruction exercise from memory, text threads, and late subcontractor updates.
“A daily report is only as strong as the crew-level facts captured to prove it.”
Claims rarely turn on “work continued today.”
They turn on specifics: who was there, what was planned, what was impacted, what condition existed, when it appeared, who was notified, what proof was captured, what action followed. Crew-level data captures those facts closer to the event.
“Field intelligence is the strongest evidence base you build for free, every day.”
The next incident is hiding in this month's field facts.
Repeat hazards, recurring blockers, and delayed closeouts show up as patterns long before they show up as incidents — by crew, trade, task, site, and phase. Captured field data is what makes those patterns visible early enough to act.
“The signal that prevents next month's incident is captured in this month's field facts.”
Three projects need attention. Northgate Tower is the most exposed because of 436 unassigned corrective actions, one serious open incident, and a slipping schedule.
- Northgate Tower
- High safety · behind schedule · margin at risk
- SeaTac Terminal
- Medium safety · tight schedule · margin eroding
- Broadway Towers
- Medium safety · on track · healthy margin
This is a decision-support ranking; leaders review the linked evidence before acting.
AI is only as useful as the context it can work from.
A generic AI tool can summarize documents. A project-document AI can answer from specs, RFIs, drawings, and submittals. Useful — but construction field AI needs more than project documents. It needs field context.
Answers from specs, RFIs, drawings, submittals, and contracts. It knows what the project said should happen — but not what the crew was doing, seeing, asking, or closing out in the moment.
Grounded in company procedures and project documents and the crew-level data SALUS captures every day — crew, task, location, risk, form, permit, hazard, question, action, and time. That's what changes the answers AI can give.
What good crew-level data should include.
Nine categories that turn isolated facts into a connected field record — the foundation of the intelligence layer.
The 6-step field data strategy.
- 01Step 1 of 6
Identify the decisions the data should support
Safety response, daily logs, claims, production visibility, executive reporting, risk insights, and AI answers — start from the decision, not the form.
- 02Step 2 of 6
Map the field moments where the data already appears
Pre-task planning, toolbox talks, permits, inspections, hazard reports, near misses, field questions, corrective actions, and daily-log updates.
- 03Step 3 of 6
Tie capture to entities
Worker, crew, trade, task, location, time, risk, form, permit, and action — so every fact knows what it belongs to.
- 04Step 4 of 6
Reduce duplicate entry
Don't make the field enter the same fact in five places. Capture once; route everywhere it's needed.
Capture once — route everywhere - 05Step 5 of 6
Decide what syncs to Procore and what stays in SALUS
Define the source of truth for each object so the project record and the field record reinforce each other instead of competing.
- 06Step 6 of 6
Govern the data
Permissions, source visibility, AI review, audit trail, privacy, and retention — so the field intelligence layer stays trusted.
The Crew-Level Data Map.
See where your field data is captured today, where context gets lost, and which crew-level facts should power your daily logs, safety records, claims documentation, Procore workflows, and AI.
Email me the data map
We’ll email you the printable version and give you immediate access here.
It’s on its way—check your inbox.
Download now- Page 1 — Field data inventoryMap 10 critical facts against where they're captured, by whom, when, and where they need to flow.
- Page 2 — Missing-layer diagnosticScore 9 dimensions from 0–2. Identify where context, proof, or ownership is missing.
- Page 3 — Field Intelligence MapA printable visual of how a single crew moment becomes a daily log, a Procore record, and a Rosie answer.
Some context is captured; meaningful gaps remain.
0 = not really · 1 = partly · 2 = yes.
Email me the data map
We’ll email you the printable version and give you immediate access here.
It’s on its way—check your inbox.
Download nowField Intelligence Map
Example: a single hazard captured at 10:14 → daily log line, Procore observation, risk-pattern signal, Rosie summary.
Common questions.
What is crew-level data?
How is this different from Procore data?
How does crew-level data improve daily reports?
How does crew-level data help with claims?
How does crew-level data make AI more useful?
Sources and context
Each source is listed for the specific context it supports; none independently validates SALUS product claims.
- Safety Management — Worker Participation
U.S. Occupational Safety and Health Administration
Primary guidance for accessible hazard and near-miss reporting, prompt follow-up, worker input, and removal of language or process barriers.
- Artificial Intelligence Risk Management Framework: Generative Artificial Intelligence Profile
U.S. National Institute of Standards and Technology
Primary guidance on content provenance, source history, transparency, testing, and documented limitations for generative AI systems.
Stop collecting records. Start connecting field facts.
The missing layer isn't another dashboard. It's the connected record of what crews were doing, seeing, asking, proving, and closing out while work happened — usable across safety, daily logs, Procore, claims, and AI.
Project record · Field record · Crew-level record · Field intelligence layer